Ticket Manager |
|

The statistics can be viewed by Teams or by Project Types. Tickets will be tabulated in a grid, showing the total number of tickets, and then a break out by subgroup (Team or Project).
Each bar chart shows how many total tickets, and is then broken down within the bar, showing how many are new, current, etc. It will also show how many tickets have been closed today. By hovering over the sections in the grid, you will see the percentage of tickets in the group versus the total percentage of open tickets.
By selecting either Teams or Project Types, and the appropriate items within the tab, the filter will remain in place until other options are selected.
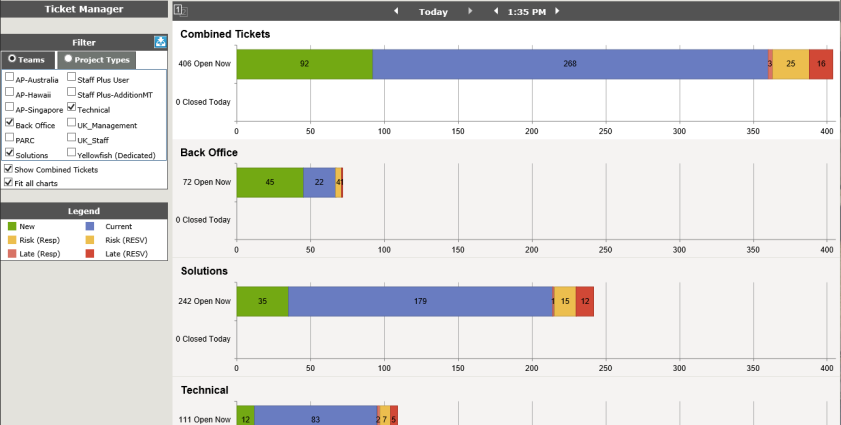
- The top bar defaults to Combined, or All, Tickets. This gives a summary of all the charts on the page. If you don't want this bar, uncheck the Show Combined Tickets box under the filter list.
- If all the information doesn't fit on one page, check the Fit to screen box under the filter list. This will put all the selected charts on one page. (Red box on the left.).
- Left click in the grid, and you will have the option to show the tickets for that particular group in a search screen or in grid format . The search option will open in a new tab; the grid option will open in the existing tab.
Note: The single screen mode of the Ticket Manager automatically defaults to the current day and time.
Compare Data
The Ticket Manager Compare option provides Administrators the option to compare global ticket statistics for open and closed tickets over a period of time.
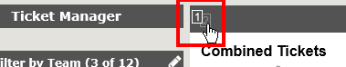
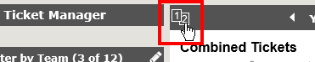
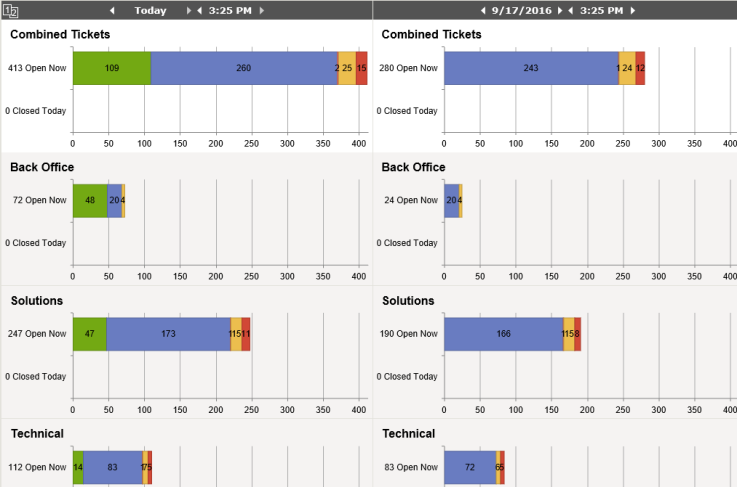
Click on the toggle switch on the top of the Ticket Manager to show two days side by side.
| Ticket Manager - One grid | Ticket Manger - Two Grids |
|
|
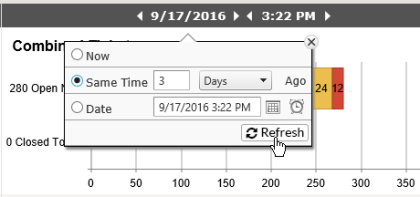
One side will automatically is set to the current day and time, the other side to Yesterday, at the current time. By clicking on the day, you can select a specific Now (today), the same time for a specified number of hours/days/weeks/months/years ago (drop down options), or select a specific date and time (from the calendar/clock options).
When the date is selected, Ticket Manager will show the information side by side. As with the single grid, you can click to get the option to show the tickets in a search screen or grid.
In the Compare mode - when you select Show Tickets in New Window on side which is not Today, the search results will be the tickets based on the selected date and time.


